
The TrinityCofE Primary Academy
2014 - 2015 Pupil Premium Strategy
The 2014 - 2015 Pupil Premium Allocation, Spending and Impact report can be downloaded here or read by scrolling down.
Impact Review
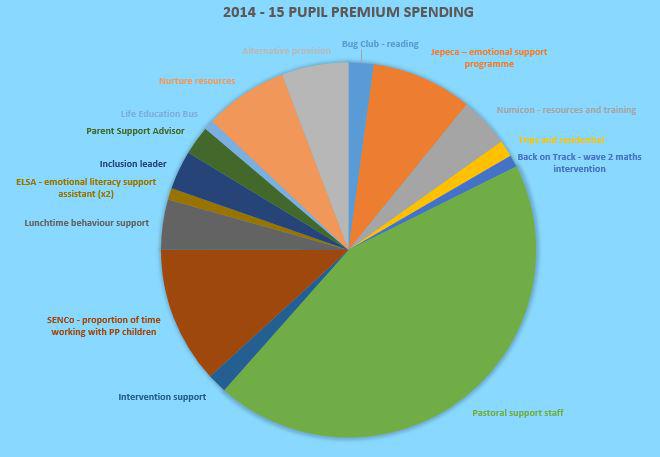
our Pupil Premium allocation amounted to: £74,900
|
Intervention |
Main Objective |
Cost |
Impact |
||||||||||||||||||||||||||||||||||||||||||||||||||||||||||||||||||||||||
|---|---|---|---|---|---|---|---|---|---|---|---|---|---|---|---|---|---|---|---|---|---|---|---|---|---|---|---|---|---|---|---|---|---|---|---|---|---|---|---|---|---|---|---|---|---|---|---|---|---|---|---|---|---|---|---|---|---|---|---|---|---|---|---|---|---|---|---|---|---|---|---|---|---|---|---|
|
Bug Club Reading |
|
£1500 |
|
||||||||||||||||||||||||||||||||||||||||||||||||||||||||||||||||||||||||
|
Jepeca |
|
£7000 |
Jepeca – full impact analysis report available (summary graph below)
|
||||||||||||||||||||||||||||||||||||||||||||||||||||||||||||||||||||||||
|
Numicon |
|
£3000 |
|
||||||||||||||||||||||||||||||||||||||||||||||||||||||||||||||||||||||||
|
Trips and residentials |
|
£1300 |
All children who wanted to take part in the year 6 residential trip was able to – parents paid the £20 deposit and school paid the balance. Parents of children eligible for pupil premium had the cost of class trips subsidised to enable full participation. |
||||||||||||||||||||||||||||||||||||||||||||||||||||||||||||||||||||||||
|
Back on Track Maths Intervention |
|
£850 |
|
||||||||||||||||||||||||||||||||||||||||||||||||||||||||||||||||||||||||
|
Pastoral Manager and Pupil Premium Champion employed as pastoral support staff. |
|
£30,500 |
Reduced number of fixed term (FTE) & permanent exclusions (PEX):
Much improved climate for learning throughout the school and improved engagement in learning. Reduced number of incidents in the school day that become a barrier to learning or a disruption to others accessing their learning. |
||||||||||||||||||||||||||||||||||||||||||||||||||||||||||||||||||||||||
|
Intervention Support |
|
£4850 |
Those eligible for Pupil Premium: Year 1 Phonics (3 children) performed well below the national percentage for pupils who achieved the expected standard (-33%) Year 2 (7 children) performed very significantly below overall (3.4) and in all 3 subjects Year 6 (9 children) performed above the national average for similar pupils overall (0.6), well above in Mathematics (1.7), above in Reading (0.7), well below in Writing (1.6) and well below in EGPS (1.2)
|
||||||||||||||||||||||||||||||||||||||||||||||||||||||||||||||||||||||||
|
SENCo time with SEN and pupil premium children |
|
£8200 |
|||||||||||||||||||||||||||||||||||||||||||||||||||||||||||||||||||||||||
|
Lunchtime Behaviour Support |
|
£3000 |
Reduced number of lunchtime incidents which have also reduced the number of fixed term exclusions. |
||||||||||||||||||||||||||||||||||||||||||||||||||||||||||||||||||||||||
|
Inclusion Leader |
|
£2500 |
Reduced number of lunchtime incidents which have also reduced the number of fixed term exclusions. |
||||||||||||||||||||||||||||||||||||||||||||||||||||||||||||||||||||||||
|
Parent Support Advisor (PSA) |
|
£1800 |
Improved attendance from 91% (July 2013) to 96% (July 2015). Reduced involvement needed from social care because of early help intervention by the PSA: |
||||||||||||||||||||||||||||||||||||||||||||||||||||||||||||||||||||||||
|
Life Education Bus |
how the body works, the importance of healthy diet and exercise, safe use of medicines, the risks of tobacco, alcohol and non-prescription drugs and emotional wellbeing (including bullying.) |
£700 |
The school has achieved Healthy School Bronze Award from Wiltshire Council for its work in improving children overall health (physical and mental). |
||||||||||||||||||||||||||||||||||||||||||||||||||||||||||||||||||||||||
|
Nurture Resources |
|
£5000 |
Improved climate for learning throughout the school and an increasing engagement in learning. |
||||||||||||||||||||||||||||||||||||||||||||||||||||||||||||||||||||||||
|
Alternative Provision |
Equine assisted learning WOLT – forest school Greatwood Horse Power |
£4000 |
Reduced exclusions and reengagement in learning for children vulnerable to exclusion. Case study evidence available for individual children. |
||||||||||||||||||||||||||||||||||||||||||||||||||||||||||||||||||||||||
|
Total |
£74,900 |
||||||||||||||||||||||||||||||||||||||||||||||||||||||||||||||||||||||||||
2014 - 15 Impact Data
Year 1 Phonics
![]()
- The Disadvantaged Pupils performed well below the national percentage for pupils who achieved the expected standard (-33%)
Key Stage 1
![]()
- The FSM pupils (7) performed very significantly below overall (3.4) and in all 3 subjects
- The Disadvantaged Pupils (7) performed very significantly below overall (3.4) and in all 3 subjects
Key Stage 2
![]()
- The FSM pupils (9) performed above the national average for similar pupils overall (0.6), well above in Mathematics (1.7), above in Reading (0.7), well below in Writing (1.6) and well below in EGPS (1.2)
- The Disadvantage Pupils (9) performed above the national average for similar pupils overall (0.6), well above in Mathematics (1.7), above in Reading (0.7), well below in Writing (1.6) and well below in EGPS (1.2)
KS1 - KS2 Progress
In Reading 89% of FSM pupils (8/9) made expected progress of which:
- 100% made expected progress from KS1 L1 (2/2) - well above the national percentage (14) and in line with non FSM
- 67% made expected progress from KS1 L2C (2/3) - well below the national percentage (-18) and well above non FSM (67)
- 100% made expected progress from KS1 L2B (1/1) - just above the national percentage (4) and in line with non FSM
- 100% made expected progress from KS1 L2A (3/3) - just above the national percentage (1) and in line with non FSM
- 100% made better than expected progress from KS1 L1 (2/2) - well above the national percentage (36) and in line with non FSM
- 33% made better than expected progress from KS1 L2C (1/3) - well above the national percentage (14) and well above non FSM (33)
- 0% made better than expected progress from KS1 L2B (0/1) - well below the national percentage (-36) and in line with non FSM
- 67% made better than expected progress from KS1 L2A (2/3) - just above the national percentage (3) and well above non FSM (67)
In Writing 89% of FSM pupils (8/9) made expected progress of which:
- 67% made expected progress from KS1 L1 (2/3) - well below the national percentage (-28) and well above non FSM (67)
- 100% made expected progress from KS1 L2C (2/2) - above the national percentage (9) and well above non FSM (50)
- 100% made expected progress from KS1 L2B (4/4) - just above the national percentage (2) and in line with non FSM
- 0% made better than expected progress from KS1 L1 (0/3) - well below the national percentage (-60) and in line with non FSM
- 0% made better than expected progress from KS1 L2C (0/2) - well below the national percentage (-11) and in line with non FSM
- 0% made better than expected progress from KS1 L2B (0/4) - well below the national percentage (-34) and in line with non FSM
In Mathematics 89% of FSM pupils (8/9) made expected progress of which:
- 50% made expected progress from KS1 L2C (1/2) - well below the national percentage (-27) and well above non FSM (50)
- 100% made expected progress from KS1 L2B (2/2) - above the national percentage (6) and well above non FSM (50)
- 100% made expected progress from KS1 L2A (5/5) - just above the national percentage (1) and in line with non FSM
- 0% made better than expected progress from KS1 L2C (0/2) - below the national percentage (-9) and in line with non FSM
- 50% made better than expected progress from KS1 L2B (1/2) - well above the national percentage (23) and well above non FSM (50)
- 60% made better than expected progress from KS1 L2A (3/5) - in line with the national percentage and well above non FSM (10)